Information
Port Statistics
Arrival actual results
| Year | Number and Total Gross Tonnage(GT) of Ships | |||||
|---|---|---|---|---|---|---|
| Ocean-Going (figures for container ships) | Coastal (figures for ferries) | Grand Total | ||||
| No. of Ships | Total GT | No. of Ships | Total GT | No. of Ships | Total GT | |
| 2017 | 5,145 (3,373) |
74,427,828 (53,683,523) |
18,135 (1,858) |
36,323,208 (20,574,706) |
23,280 | 110,751,036 |
| 2018 | 5,156 (3,517) |
76,727,367 (57,031,017) |
17,946 (1,770) |
36,229,691 (20,371,387) |
23,102 | 112,957,058 |
| 2019 | 5,042 (3,554) |
76,625,917 (57,110,692) |
17,580 (1,777) |
38,334,013 (22,161,486) |
22,622 | 114,959,930 |
| 2020 | 4,743 (3,433) |
66,056,359 (53,312,010) |
16,375 (1,771) |
38,106,778 (22,160,571) |
21,118 | 104,163,137 |
| 2021 | 4,594 (3,217) |
61,870,896 (48,459,228) |
17,487 (1,796) |
39,144,750 (22,455,316) |
22,081 | 101,015,646 |
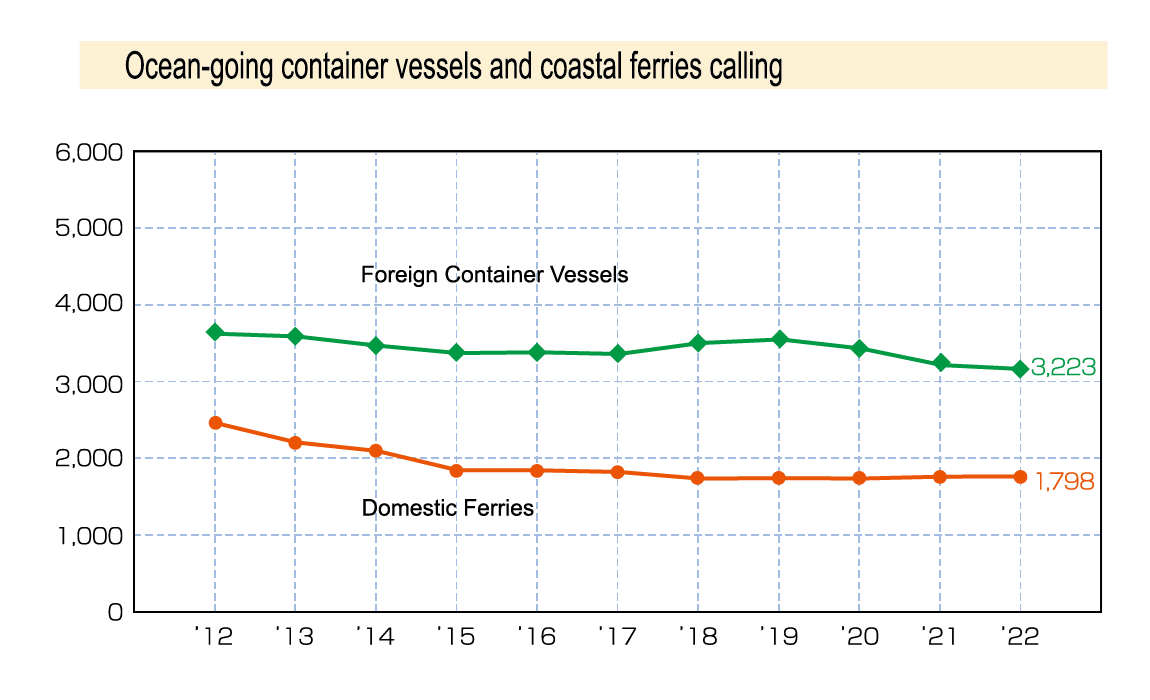
| 2022 | 4,494 (3,152) |
60,761,644 (46,658,042) |
16,771 (1,798) |
40,232,974 (24,001,186) |
21,265 | 100,994,618 |
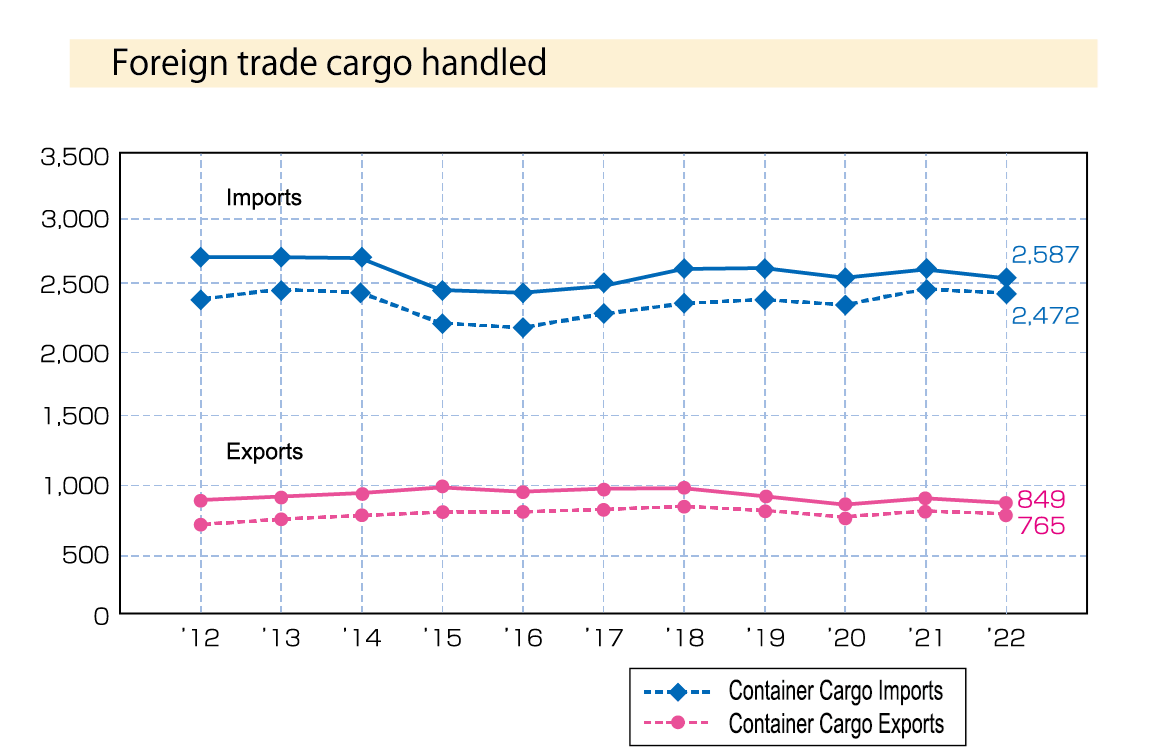
The amount of freight handling
(Total numbers may not add up due to rounding.)
| Year | Volume of Cargo Handled(thousand tons) | ||||||
|---|---|---|---|---|---|---|---|
| Foreign Trade (figures for container cargo) |
Domestic Trade (figures for ferry cargo) |
Grand Total | |||||
| Export | Import | Total | Outgoing | Incoming | Total | ||
| 2017 | 9,587 (7,994) |
25,258 (23,113) |
34,845 (31,108) |
21,836 (15,588) |
27,985 (16,830) |
49,820 (32,419) |
84,666 |
| 2018 | 9,626 (8,218) |
26,592 (23,924) |
36,218 (32,141) |
21,384 (15,216) |
26,677 (16,212) |
48,061 (31,428) |
84,279 |
| 2019 | 9,014 (7,915) |
26,656 (24,228) |
35,670 (32,143) |
21,908 (15,555) |
27,612 (16,949) |
49,520 (32,504) |
85,189 |
| 2020 | 8,362 (7,411) |
25,913 (23,811) |
34,274 (31,222) |
20,337 (14,350) |
25,935 (15,997) |
46,272 (30,347) |
80,547 |
| 2021 | 8,849 (7,867) |
26,554 (25,038) |
35,403 (32,905) |
21,512 (15,086) |
27,753 (16,907) |
49,265 (31,993) |
84,668 |
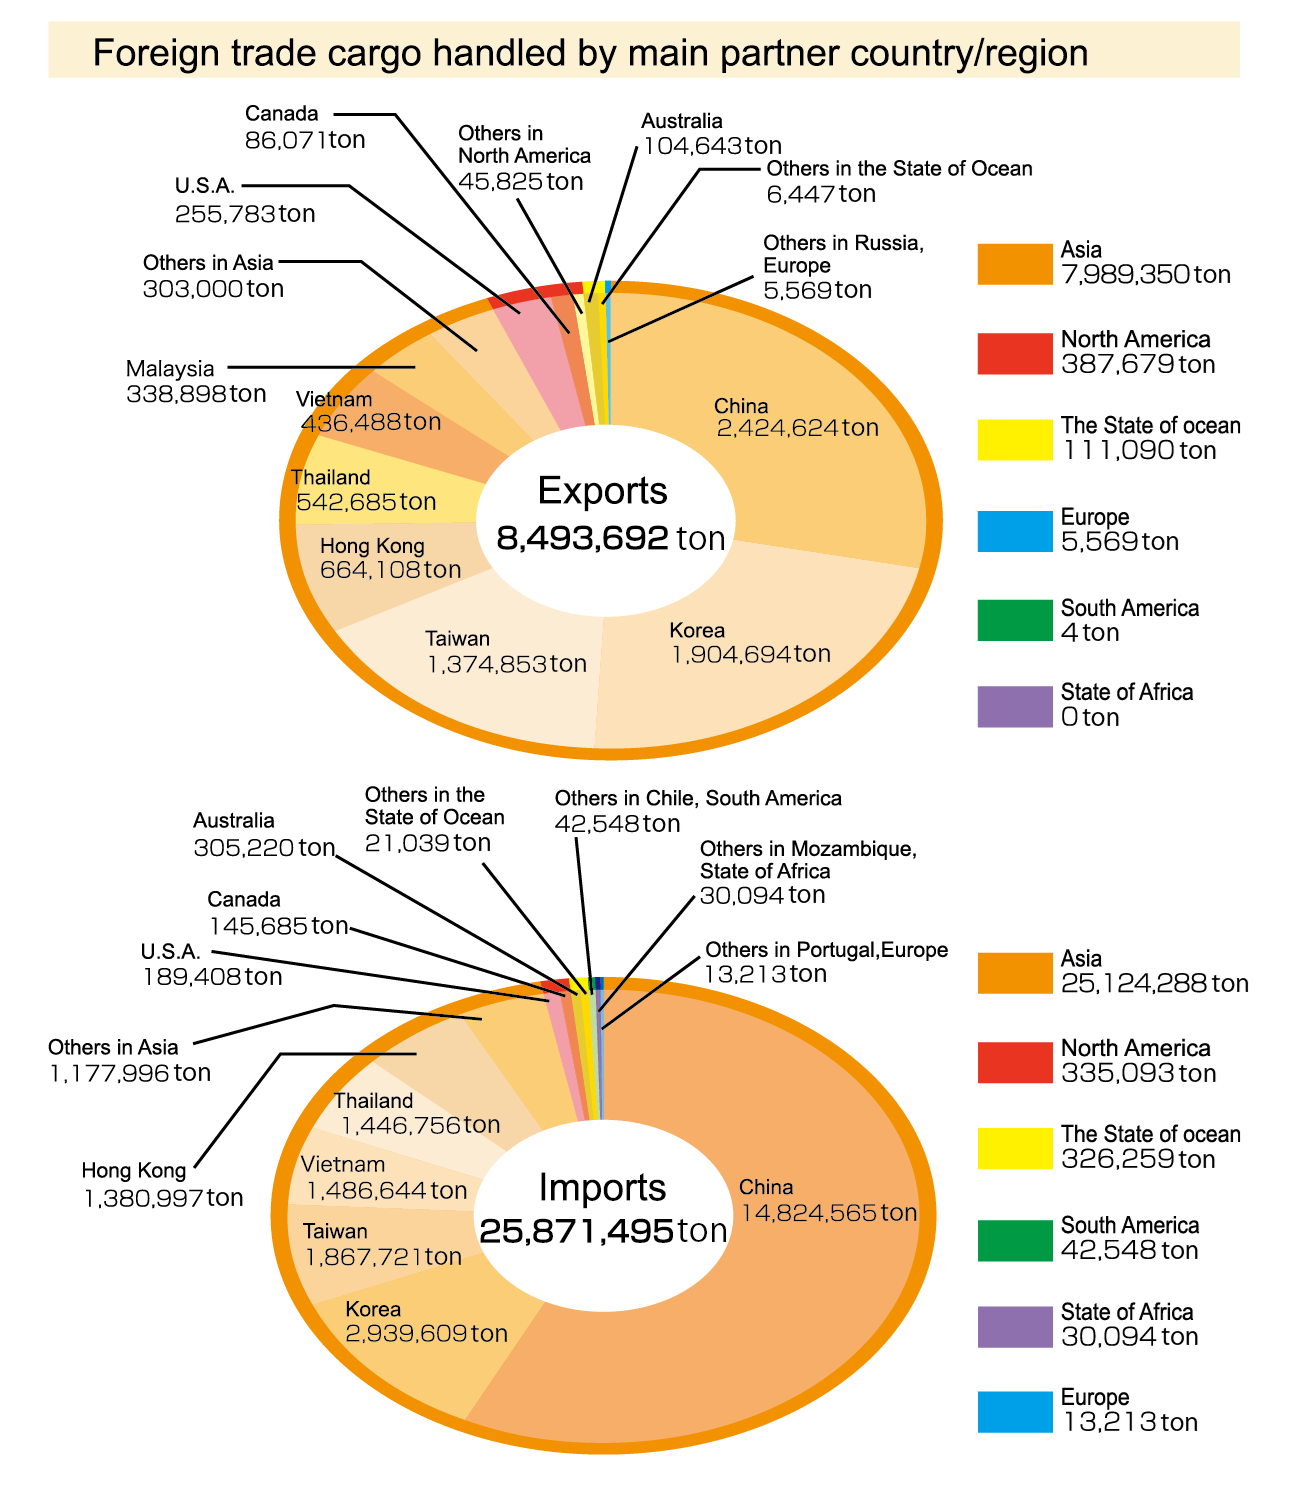
| 2022 | 8,494 (7,649) |
25,871 (24,725) |
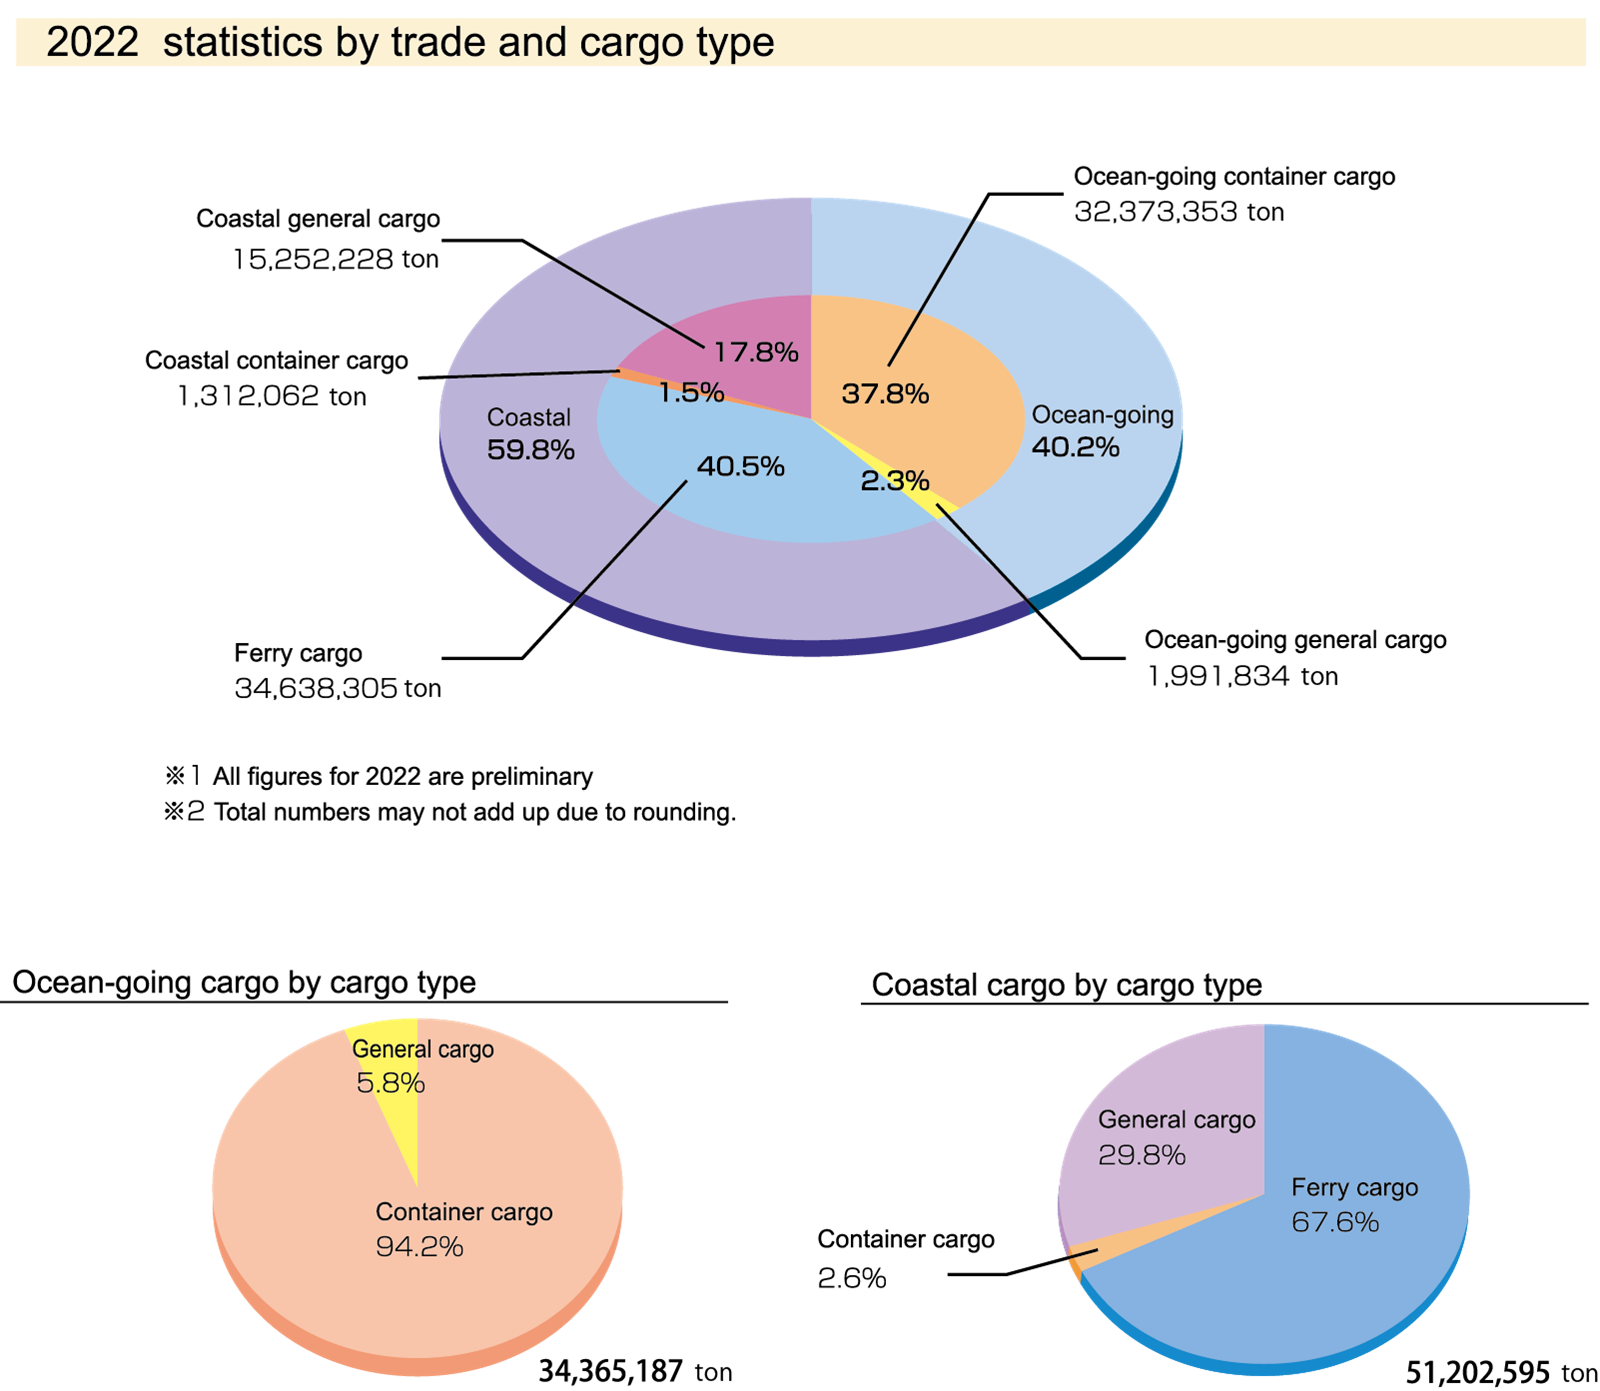
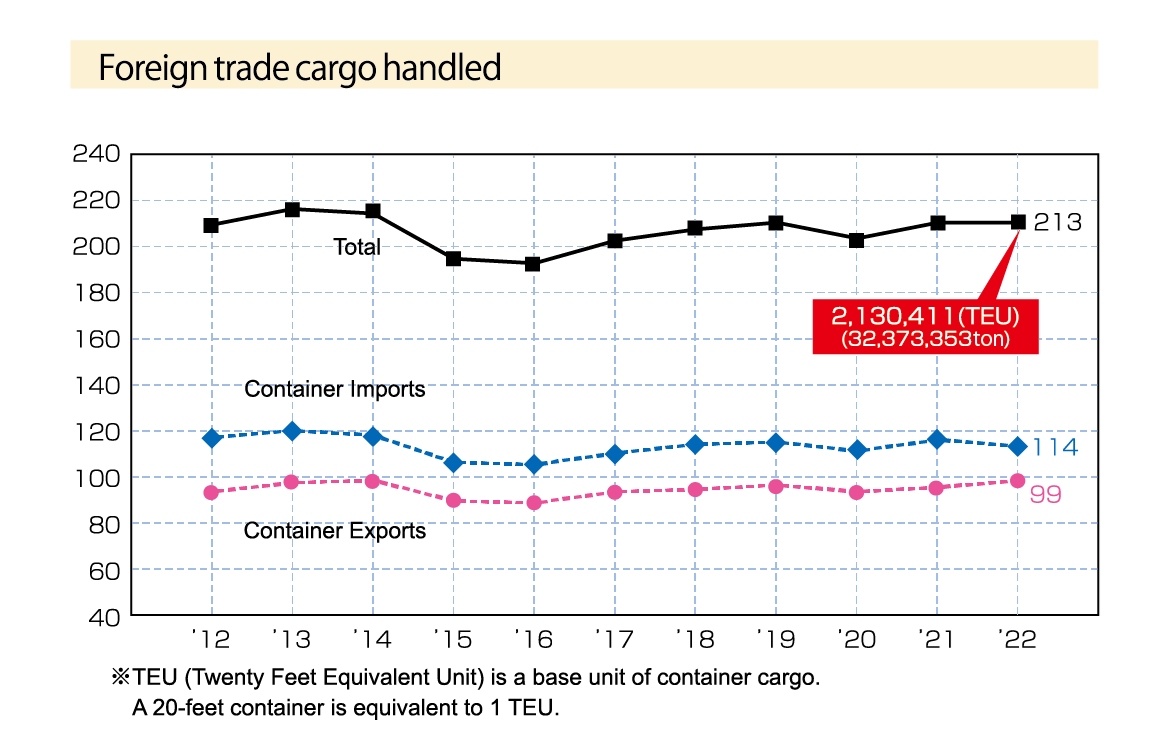
34,365 (32,373) |
22,476 (16,337) |
28,727 (18,302) |
51,203 (34,638) |
85,568 |
The amount of foreign trade
(Source : Osaka Customs Trade Statistics)
| Year | Value of Foreign Trade(¥ million) | ||
|---|---|---|---|
| Export | Import | Total | |
| 2017 | 3,674,184 | 4,755,320 | 8,429,504 |
| 2018 | 4,242,687 | 4,971,306 | 9,213,993 |
| 2019 | 3,774,242 | 4,778,131 | 8,552,373 |
| 2020 | 3,808,736 | 4,516,784 | 8,325,520 |
| 2021 | 4,698,073 | 5,096,679 | 9,794,752 |
| 2022 | 5,001,936 | 6,309,699 | 11,311,635 |
Number of Vessels Calling
Cargo Handled (ten thousand tons)
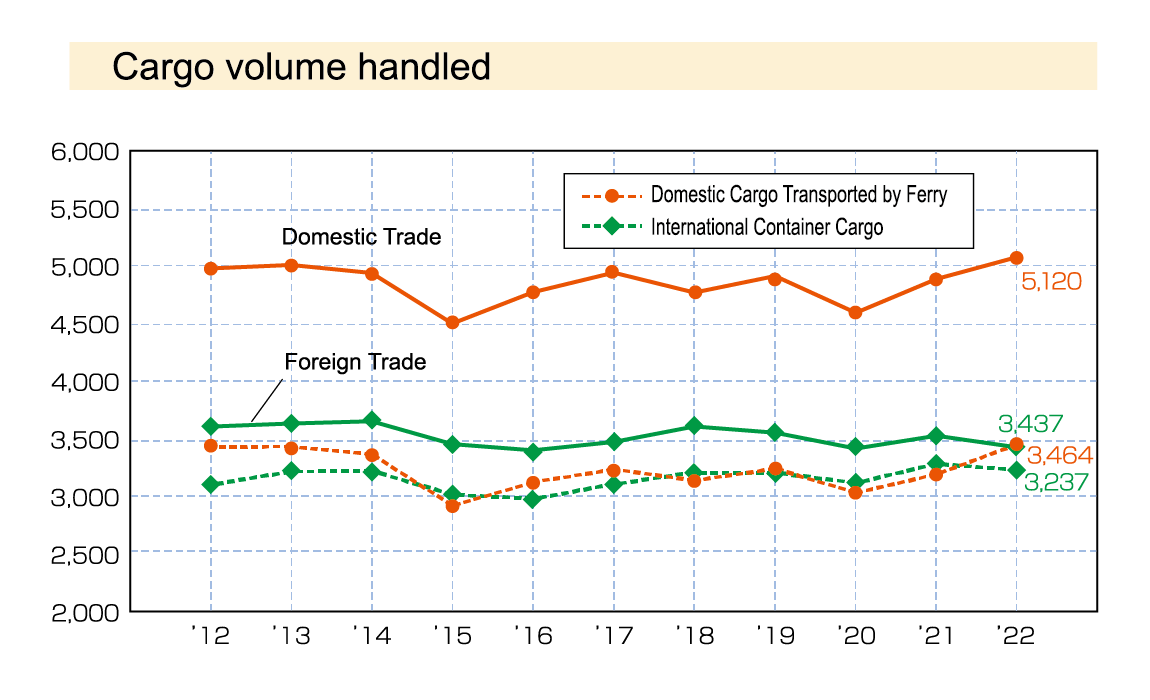
Imports and Exports (ten thousand tons)
Ocean going container Cargo Handled (ten thousand TEU)
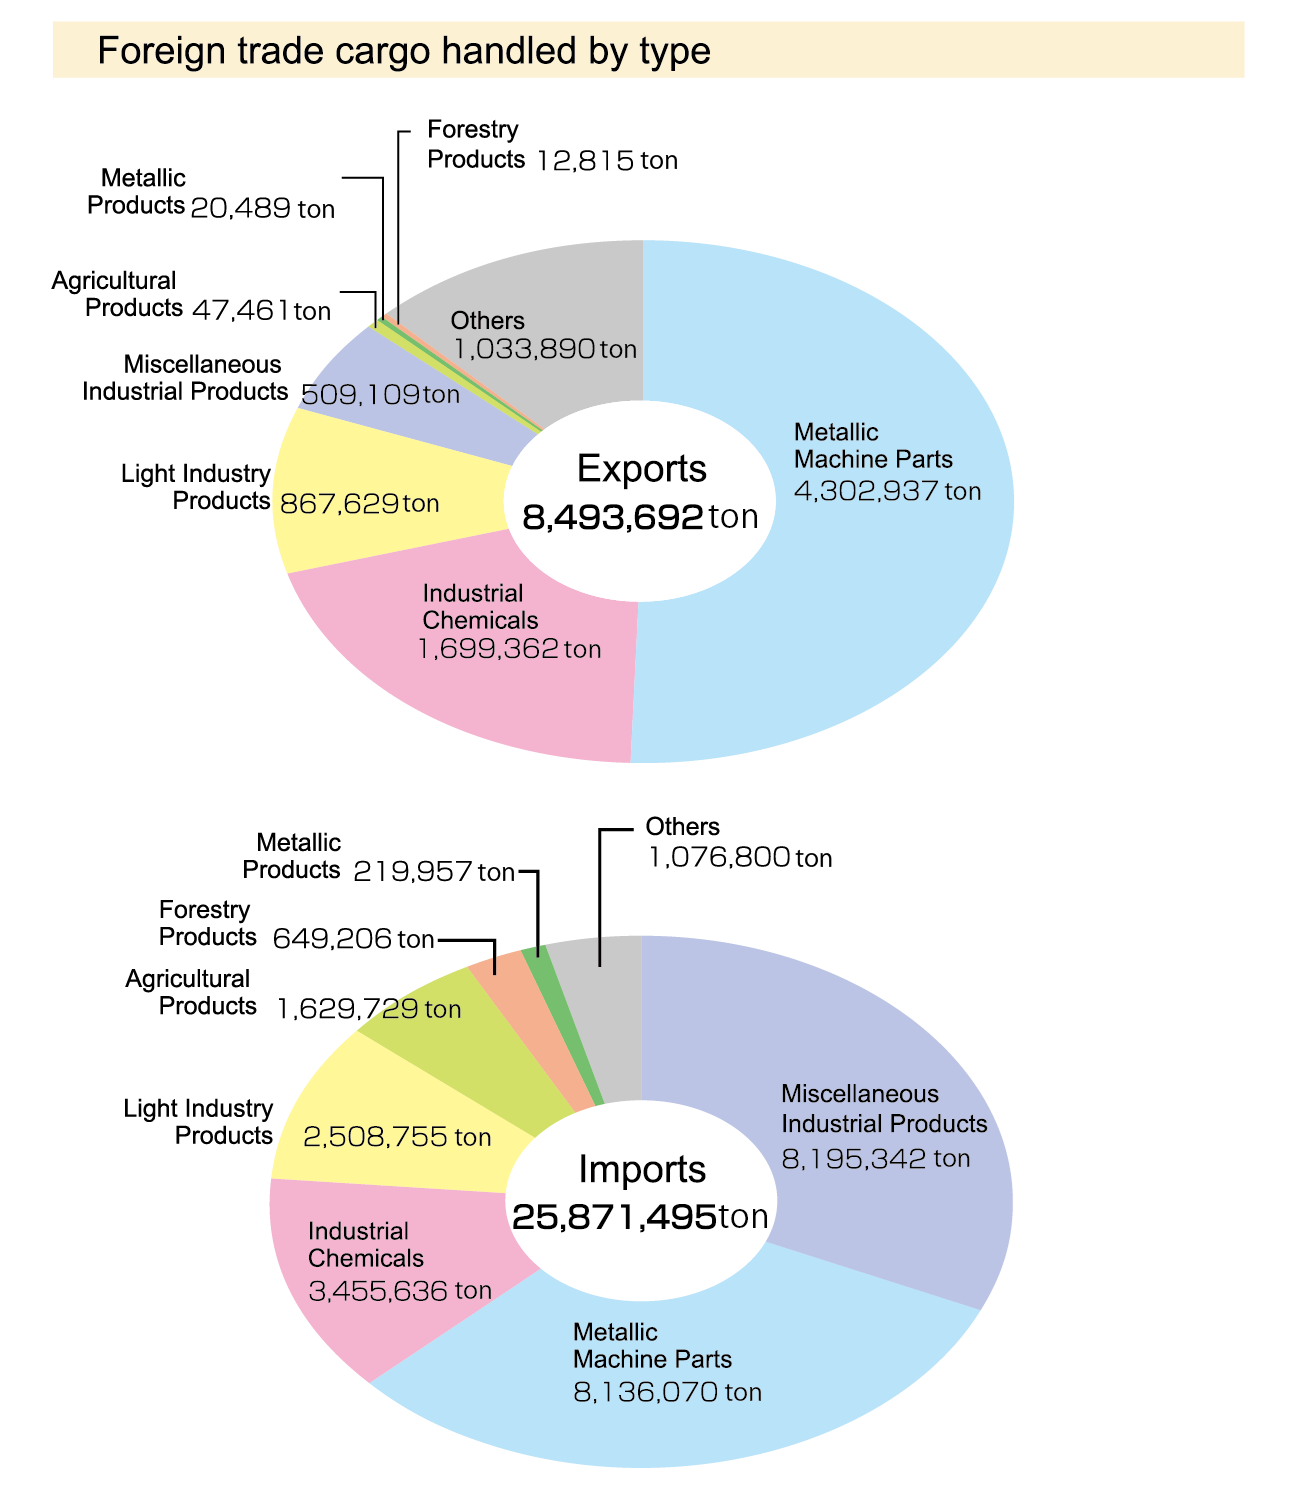
Variety of cargo (2022) :ton
Main Trade Partners (2022) :ton